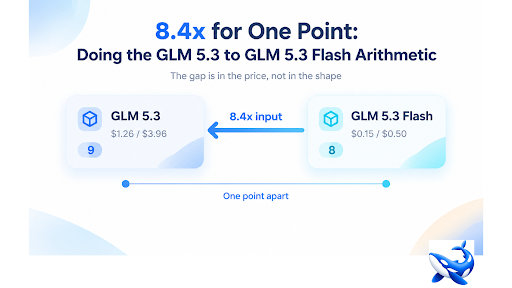

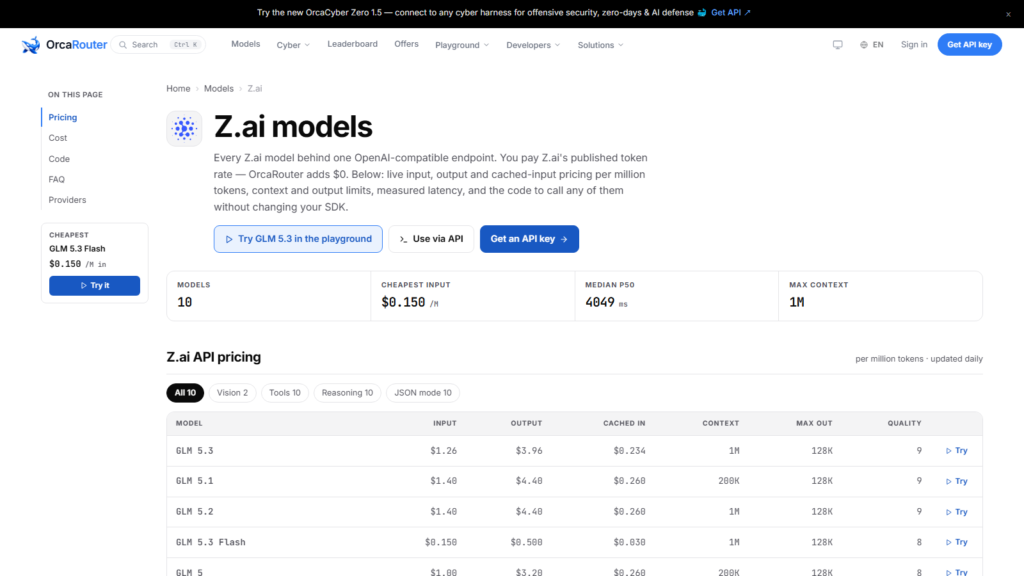
Take $1.26 and divide it by $0.15 and you get 8.4 — and OrcaRouter prints both sides of that division on one page, the z.ai models table: GLM 5.3 is billed at $1.26 input and $3.96 output per million tokens, GLM 5.3 Flash at $0.15 and $0.50, and on our own 0-to-10 quality composite — ours, built by grading each model across our own quality dimensions, not a third-party benchmark — the two rows sit one point apart, 9 and 8.
One point. Eight and a half times the input price. The rest of this page is arithmetic, because that is what the gap actually asks for: not a preference, not a vibe about which model feels smarter, but a monthly figure for what the extra point costs and whether the workload can tell the two apart.
The ratio survives the workload
A price gap is only interesting if it holds up when you change the assumptions, so start by testing it. The two rows charge nearly identical multipliers — 3.96 divided by 1.26 is 3.14, and 0.50 divided by 0.15 is 3.33 — which means the 8.4x input gap does not shrink or swing when you change the input-to-output mix.
| Input share of the workload | GLM 5.3 blended $/1M | GLM 5.3 Flash blended $/1M | Ratio |
| 90% input / 10% output | $1.53 | $0.185 | 8.3x |
| 70% input / 30% output | $2.07 | $0.255 | 8.1x |
| 50% input / 50% output | $2.61 | $0.325 | 8.0x |
That is the useful property of this pair: the ratio is stable between roughly 8.0x and 8.4x no matter what your workload looks like. Read-heavy, write-heavy, balanced — the cheap row is about eight times cheaper per token throughout. Most model comparisons break when the workload changes, because one row has a flattering input price and an ugly output price. This pair does not, and that removes an entire category of uncertainty from the decision. The question is no longer whether the cheaper row is cheaper for your traffic. It is, at every mix. The question is what the extra point buys.
The same volume, two monthly bills
Pick a realistic shape: 120 million input tokens and 30 million output tokens in a month. That is a service doing serious extraction or analysis work — tens of thousands of substantial requests — and it is the kind of number a team can actually recognise in their own dashboard.
| Monthly volume | GLM 5.3 | GLM 5.3 Flash | Difference |
| 10M in / 2.5M out | $22.50 | $2.75 | $19.75 |
| 60M in / 15M out | $135.00 | $16.50 | $118.50 |
| 120M in / 30M out | $270.00 | $33.00 | $237.00 |
| 600M in / 150M out | $1,350.00 | $165.00 | $1,185.00 |
At the middle row the arithmetic is: 120 million input tokens at $1.26 is $151.20, 30 million output tokens at $3.96 is $118.80, and the flagship bills $270.00 for the month. The Flash row is 120 million at $0.15 ($18.00) plus 30 million at $0.50 ($15.00), which is $33.00. The difference is $237.00 in a single month — $2,844.00 across a year, for one point on a 0-to-10 composite that we build ourselves.
Read that number at several scales, because the answer to “is the point worth it” changes with volume rather than with anything about the models. At the small end the gap is $19.75 a month, which is a rounding error against engineering time. At the large end it is $1,185.00 a month, which is a salary. The same one-point decision costs twenty dollars at one company and fourteen thousand dollars a year at another, and neither of them is making a mistake.
What one composite point actually buys
The composite is the part that needs the most care, because it is the only number in the whole calculation that is not a price. Our 0-to-10 score is our own instrument — we grade each model across our own quality dimensions and publish the digit; it is not a third-party benchmark and it is not Z.ai’s claim about its own models. A composite of that kind is deliberately coarse. It places a model in a tier. It does not tell you that 9 is exactly twelve and a half percent better than 8, and it should not be read that way.
What it does tell you is that the two rows are close enough to be mentioned in the same breath, which is precisely why the price gap is the interesting fact rather than the score gap. If the composite had put these rows four points apart, the decision would be a capability decision and the money would be secondary. At one point, the money is the decision, and the engineering question becomes concrete: does GLM 5.3 Flash make errors that cost more than $237 a month to find and fix?
That is a question with a real answer, and it is worth writing the number down. If the cheaper row’s failures land in a queue that somebody already reviews, the extra point saves nothing and the $2,844 a year is pure waste. If those failures reach customers, route around them, or need a second pass from a stronger model to clean up, the cleanup is a billable line item — and once it exceeds $237 a month, the flagship stops being the expensive row.
The rows are not differently shaped
Here is the detail that makes this trade unusual: the two rows have the same published envelope. Both hold a 1M context window. Both publish a 128K maximum output. There is no smaller window on the cheaper row, no truncated completion ceiling, no reduced capability surface that you would normally accept as the price of the discount.
That matters because most cheap-versus-flagship pairs on a model catalogue are not really a price comparison at all — they are two different products, and the discount is paid for with a narrower window or a shorter output or a feature that is simply absent. Those comparisons are easy: pick the shape your workload needs and the price follows. This one is hard, because the shapes match. The differences you can see in the table are the two rates and the one composite point, and everything else about the rows is the same. When a cheaper row is also a smaller row, price is a tiebreaker. When it is not, price is the whole question.
The row billed at $0.00 per request
The catalogue has a third GLM row that breaks the arithmetic entirely, and it is worth separating from the two above because it is easy to misread. `GLM 5.3 Flash (Free)` is listed at $0.00 per request with a 1M context window and a 128K maximum output. That is per-request billing, not free tokens: the unit of sale is the API call, and the row is not a token-rate row you can multiply by a token budget. There is no allowance to spend down and no token counter to watch, because the counter is not part of the pricing.
Per-request billing changes the forecast variable, and that is the part teams get wrong. For the two token-priced rows above, cost scales with the size of your requests — a long context costs more, a long completion costs more. On a per-request row it scales with the number of calls instead, so the planning number you carry is a call budget rather than a token budget, and packing more work into a single call changes the arithmetic differently than it would on a token meter. Forecast this row the way you forecast the other two and the model will be wrong in a direction that has nothing to do with your traffic.
The takeaway
The GLM 5.3 to GLM 5.3 Flash decision is arithmetic, not taste, and the arithmetic is unusually clean: 8.4x on input, 7.9x on output, a ratio that stays between 8.0x and 8.4x across every workload mix, and a monthly difference that runs from about $20 to about $1,185 depending only on volume. The two rows share a 1M window and a 128K output ceiling, so nothing is being sacrificed structurally for the discount — only one point on a composite that we make ourselves and that we would not read as a precise measurement even if it were more than one point.
So write the number next to your volume and then ask the only question that matters: do the cheaper row’s mistakes cost more than that per month to catch? If they do not, the flagship is the expensive choice regardless of what the quality column says.
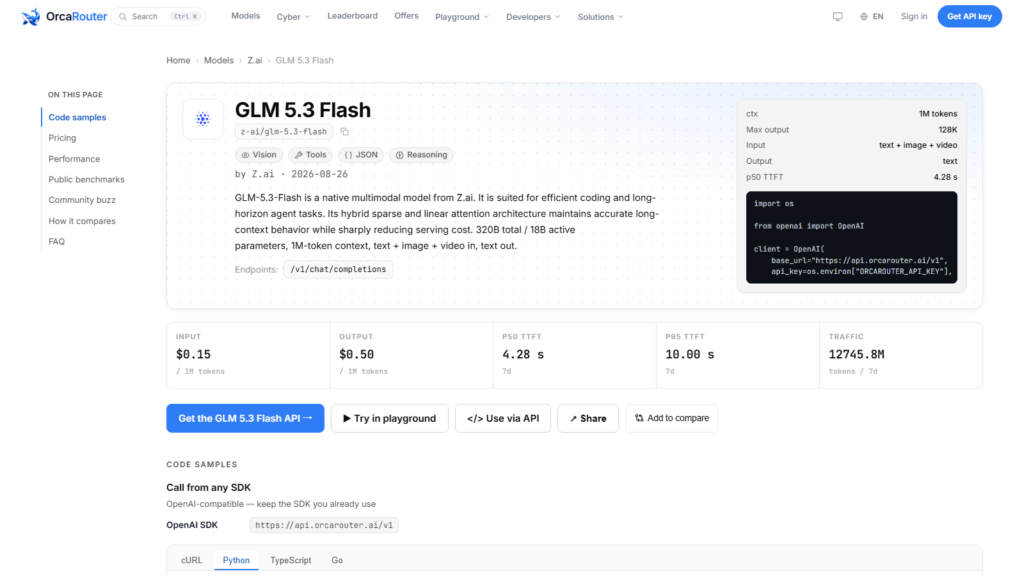
Sourcing note: the model rows, the $1.26 / $3.96 and $0.15 / $0.50 rates, the 1M context windows, the 128K maximum outputs and the $0.00 per request row are from the OrcaRouter Z.ai provider page and the linked model page, read 2026-10-14. Prices are the vendor’s published rates with $0 markup [VENDOR]. The 0-to-10 quality scores are our own composite, built by grading each model across our own quality dimensions — not a third-party benchmark — and every monthly figure in the tables is our arithmetic on those published rates [OURS]. The per-request row is billed by the call, not by tokens. All figures read 2026-10-14.